How Do I Profile eBPF Code?
TL;DR AI
2 min readKey summary
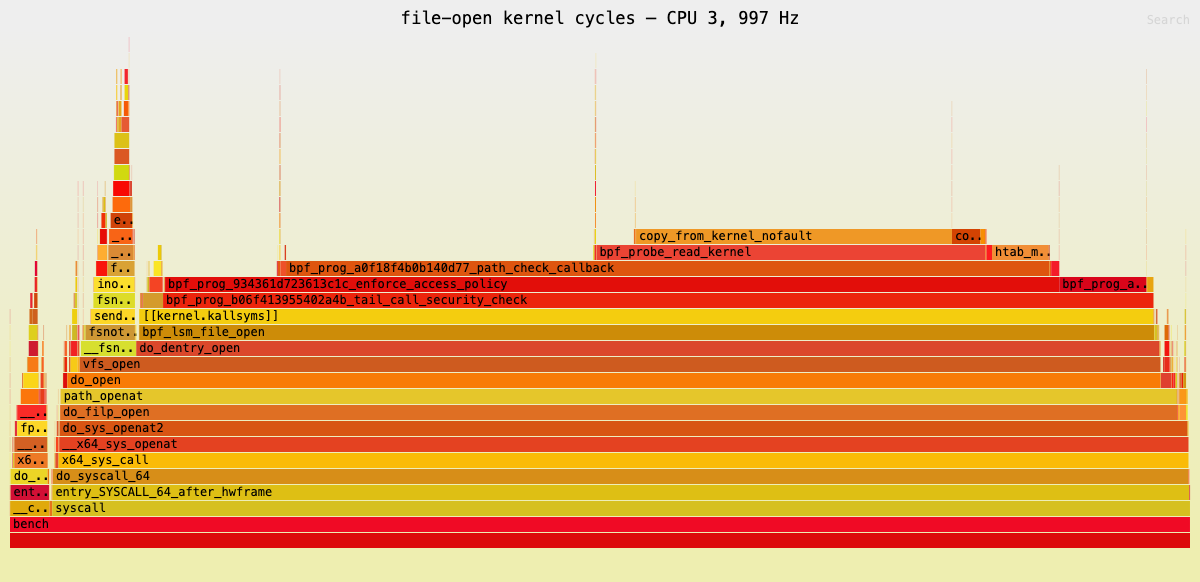
The article benchmarks file-open latency by repeatedly calling `openat` on a warm-cache file, discarding a warmup slice, and comparing timings before and after an eBPF LSM hook is attached.
It shows how to measure overhead with a minimal C harness and report distribution metrics such as p50 and p99, making before-and-after comparisons straightforward.
The setup also covers enabling BPF JIT symbol visibility and using tools like `bpftool`, `perf`, `rg`, and `/proc/kallsyms` to inspect the profiled eBPF program on a custom kernel.
The main takeaway is a practical method to isolate latency added by eBPF file-open hooks and identify performance bottlenecks.
Same topic