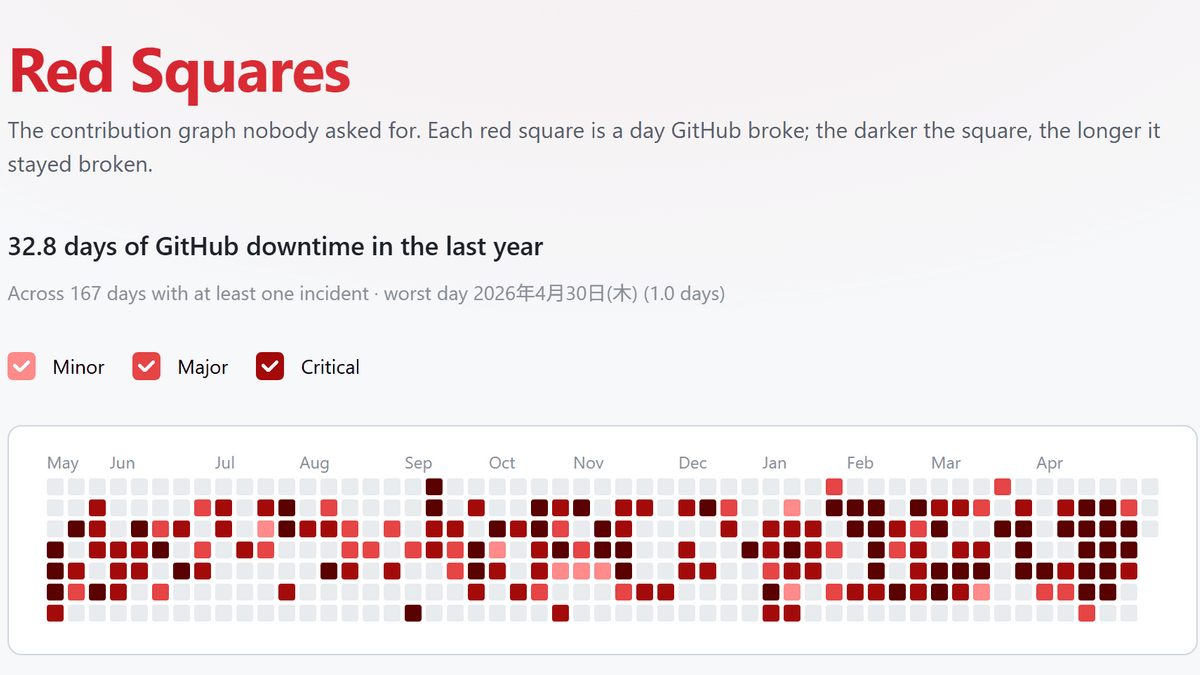
"Red Squares" visualizes GitHub's downtime over the past year in a grass-like format
TL;DR AI
1 min readKey summary
An unofficial site called Red Squares visualizes GitHub's past year of outages as a red contribution-style grid.
The data shows about 32.8 days of downtime and 168 outage days over the last year.
The visualization makes the scale and frequency of GitHub disruptions easier to grasp for users who depend on the platform.
Same topic